

Authorship, review and evidence boundary
- Technical review
- East Baoyu Product & Quality Review Desk
- Reviewed
- 2026-07-23
- Scope
- General engineering and procurement guidance. This article is not a project design, geotechnical report, certificate, warranty, code interpretation or contract requirement.
Evidence basis: Sandia and NREL PV modelling resources plus established energy-yield and lifecycle economic practice. No universal tracker gain or cost advantage is claimed.
Read the Editorial PolicyShort answer: compare fixed-tilt and tracking PV with one weather file, one module/inverter basis, consistent loss assumptions and layouts that respect the same land, grid and geotechnical boundaries. Evaluate annual and hourly energy, clipping, availability, degradation, capital and operating cost, schedule and risk. A tracker’s gross yield uplift is not the same as its net project value.
The purpose of the model is to support a transparent decision, not to force a preferred technology. Every important difference should be traceable to an input, a layout consequence or an operating assumption that can be challenged and updated.
Build one comparison basis
| Model area | Keep common | Allow to differ | Review output |
|---|---|---|---|
| Resource | Weather period, irradiance and temperature source. | Plane-of-array transposition and rear-side view from each geometry. | Monthly and hourly resource at the modules. |
| Electrical | Module and inverter families where commercially valid. | Stringing, DC/AC ratio, cable routes and clipping. | Energy waterfall and clipping profile. |
| Layout | Site boundary, setbacks, roads and exclusions. | Pitch, row length, block arrangement and terrain strategy. | MW installed, land use and grading quantities. |
| Losses | Definitions and calculation method. | Technology-specific shading, mismatch, availability, stow and auxiliary loads. | Loss table with evidence level. |
| Economics | Currency, base date, discount and escalation method. | Structures, drives, controls, installation and maintenance scope. | LCOE/NPV or owner metric plus sensitivity. |
Start from a reviewed solar resource
Use a weather dataset appropriate to the site and study purpose. Record source, period, spatial resolution, time convention, measured-versus-modelled status and any long-term adjustment. Compare annual global horizontal, direct normal and diffuse components, temperature and wind with other credible sources to identify bias or abnormal years.
Tracking value depends strongly on the direct component and hourly distribution. An annual irradiance total alone cannot show morning/evening benefit, cloudy diffuse periods or the timing of grid constraints. Preserve hourly or sub-hourly data through the model where dispatch, clipping or curtailment depends on time.
For bifacial modules, define albedo, seasonal ground condition, height, rear-side shading and mismatch method. Do not reuse one generic bifacial gain for two layouts with different clearance, pitch, torque-tube shading or ground coverage.
Model fixed-tilt geometry honestly
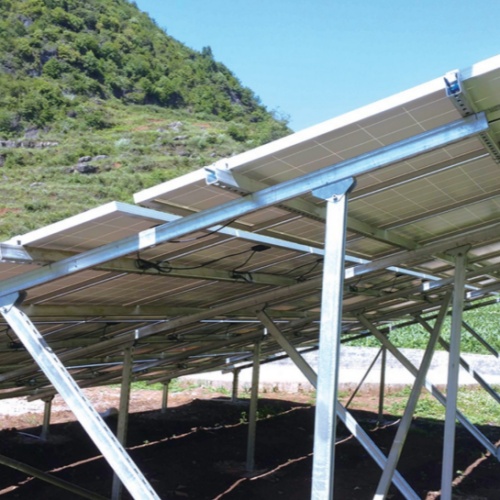
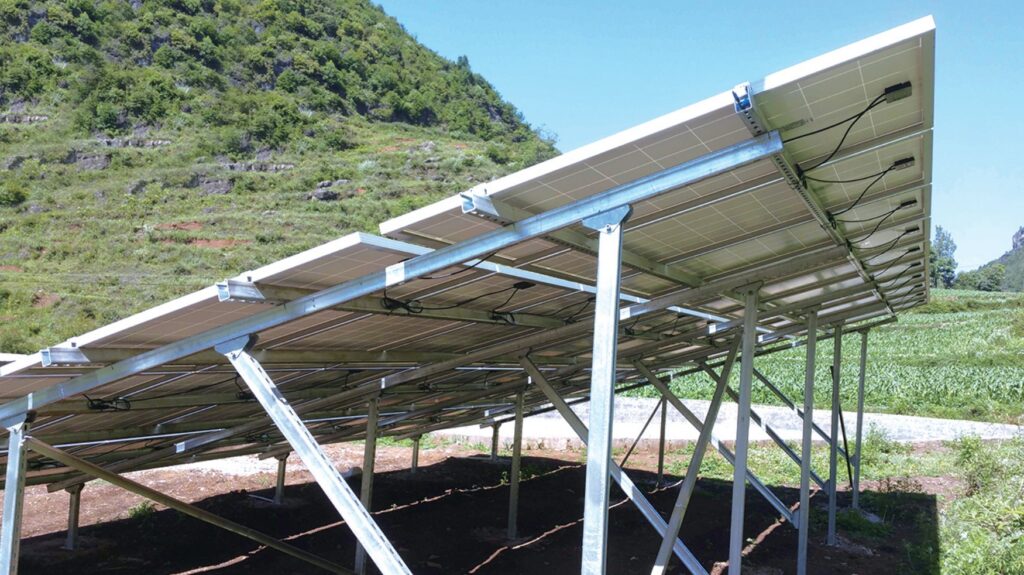
Set azimuth, tilt, row pitch, table size, height and terrain orientation from a buildable concept. Model near shading and horizon effects with the same level of detail used for the tracker. Steeper tilt can improve some seasonal production or soiling response but increases spacing, wind demand and structure height.
Fixed-tilt layouts can use long tables and relatively simple connections, yet complex terrain may still require steps, variable post projection, grading or smaller blocks. Capture structural steel, foundations, pile or screw refusal risk, drainage, road access and cable routing. “No moving parts” does not mean “no site complexity.”
Model tracker operation, not an ideal axis
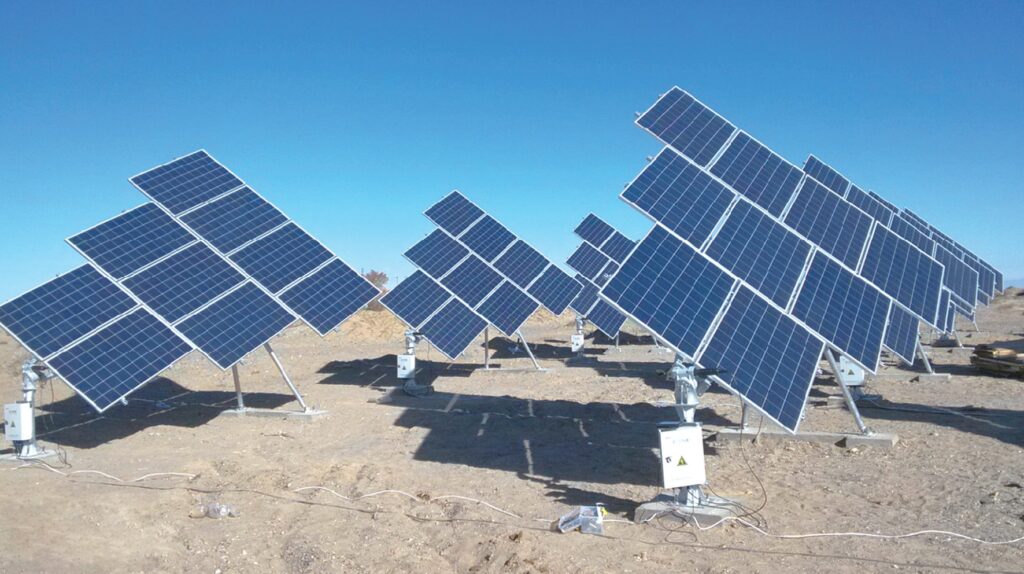
Define axis orientation, rotation limits, ground-coverage ratio, row length, drive layout, backtracking algorithm, terrain following, stow logic and mechanical or control availability. Include self-shading and row-to-row shading under the actual backtracking strategy.
Tracker energy can be lost through wind stow, snow or hail modes, night stow, maintenance, drive faults, communication outages and conservative angle limits. Use site and supplier evidence for assumptions, and run a range when evidence is immature. Link structural safety assumptions to the control strategy described in Solar Tracker Wind Load and Stow Strategy.
Terrain affects driveline alignment and row length. A layout that maximises ideal energy may create excessive grading, short rows, more drive units or difficult foundations. The energy team and civil/structural team should iterate the same coordinates rather than model separate conceptual sites.
Use a transparent energy-loss waterfall
Start with plane-of-array resource and show each transformation to delivered AC energy. Typical categories include optical effects, soiling, snow where relevant, shading, spectral or incidence-angle effects, module quality and mismatch, temperature, DC wiring, inverter conversion, clipping, transformer and AC losses, availability, auxiliary consumption and grid curtailment.
Avoid double counting. A tracker fault may already be captured in availability; do not also subtract the same event as generic mismatch without explanation. Keep physical losses separate from commercial curtailment and grid unavailability because their mitigation and risk owners differ.
For every material assumption, record source, status and sensitivity range. Label values as measured, vendor-supported, benchmarked or preliminary. This makes the model useful during development: uncertain inputs can be replaced without rebuilding the reasoning.
Compare power shape, clipping and grid value
Annual MWh can hide important differences. Plot monthly energy and representative hourly profiles. Tracking often shifts more production into morning and afternoon, while fixed tilt may concentrate nearer solar noon depending on orientation. The value depends on tariff, merchant price, export limit, storage strategy and load profile.
Use the same grid interconnection limit and optimise DC/AC ratio consistently. If one concept has more DC capacity within the land boundary, show both energy per installed kWp and energy per site or grid connection. Report clipping by month and hour so the economic model can distinguish recoverable generation from constrained output.
Where curtailment rules are complex, simulate the dispatch logic rather than applying one annual percentage. A tracker benefit during already-curtailed hours may have little commercial value, while shoulder-hour output may be valuable.
Bring constructability into the energy decision
| Project factor | Fixed-tilt question | Tracker question | Common evidence |
|---|---|---|---|
| Terrain | Can tables step or follow slope without excessive grading? | Can torque tubes and drives tolerate cross-slope and longitudinal variation? | Topographic model and grading quantities. |
| Foundations | What reactions, repetition and adjustment range control? | How do dynamic/stow loads and alignment change foundations? | Ground investigation, reaction schedule and trial plan. |
| Installation | How many parts, joints and work fronts are required? | How are drives, bearings, sensors and commissioning integrated? | Method, productivity basis and resource plan. |
| Operations | How are cleaning, vegetation and corrosion inspected? | How are moving parts, backup power, communications and stow tested? | O&M task list, spares and availability model. |
Compare lifecycle economics with matched scope
Capital cost should include modules, inverters, structures, foundations, drives, controls, sensors, cables, roads, drainage, grading, installation, tests, commissioning, spares and owner/EPC indirects under the same boundary. Identify technology-specific contingencies instead of burying them in one percentage.
Operating cost should include planned inspections, vegetation and cleaning, corrective labour, spare drives or bearings, sensor calibration, backup-energy replacement, corrosion repairs, software support and access equipment. Model lost energy during faults and maintenance consistently with the energy availability assumption.
Use a lifecycle metric suitable for the owner—such as net present value, levelised energy cost or equity return—and show nominal/real conventions, discount rate, inflation, degradation and replacement timing. The decision should not rest on a single central case.
Run sensitivities that can change the winner
- Direct normal irradiance and interannual resource variation.
- Tracker energy gain and mechanical/control availability.
- Wind-stow and other protective-mode energy losses.
- Terrain grading, foundation quantity and refusal or remediation allowance.
- Steel, drive, electrical and installation cost.
- Export limitation, curtailment and time-of-delivery price.
- Operating labour, spare parts and major replacement.
- Schedule delay and financing impact.
Use a tornado chart or scenario matrix to show which uncertainties drive the result. If a small change reverses the decision, the project needs more evidence before technology freeze.
Minimum model handover package
Provide the weather source, site boundary and layout files, equipment datasheets, software and version, parameter report, loss table, monthly/hourly outputs, clipping and curtailment logic, cost basis, assumptions register, sensitivities and review comments. A reviewer should be able to reproduce the central comparison or understand why results changed between versions.
Freeze the selected configuration through approved coordinates, product data, structural reactions and control requirements. Energy yield is one input to design—not a substitute for wind, geotechnical, electrical and manufacturing verification.
Maintain a comparison register as the project develops. When module rating, inverter loading, row spacing, grading, tracker range, stow setting or foundation concept changes, record which model inputs and cost items need reissue. Re-run both alternatives when a common boundary changes; updating only the preferred case destroys comparability. At financial close or design freeze, archive the reproducible source model, final scenarios and approval note rather than only a presentation summary.
Keep the rejected option and decision rationale in the controlled project record for future review.
Frequently asked questions
How much more energy does a tracker produce?
There is no universal percentage. It varies with direct irradiance, latitude, layout, backtracking, stow, terrain, availability, clipping and curtailment. Use a site-specific hourly model.
Is fixed tilt always lower cost?
It often has fewer active components, but installed cost depends on steel, foundation, grading, land, labour and electrical layout. Compare complete buildable concepts.
Which is better on sloping terrain?
It depends on slope direction, variation, allowable grading and product geometry. Both systems have terrain limits that should be reviewed against actual coordinates.
Should LCOE decide the technology?
LCOE is useful but may not capture time-of-delivery value, financing, schedule, grid constraints or owner risk. Use it with power-shape and scenario results.
What should be independently reviewed?
Review resource choice, layout geometry, loss assumptions, tracker logic, energy software inputs, cost boundary and sensitivity ranges. High-impact vendor assumptions deserve supporting evidence.
Compare two buildable mounting concepts
Explore the fixed PV mounting and solar tracking routes, then share the site layout, resource basis and project constraints for a controlled technical discussion.
Fixed versus tracking decision table
| Decision area | Inputs to confirm | Verification output |
|---|---|---|
| Energy model | Irradiance, terrain, shading, availability and loss assumptions | Project yield model with stated inputs |
| Structural route | Wind, snow, stow angle, row length and foundation interface | Design basis and governing load cases |
| Lifecycle choice | Controls, maintenance, spares, access and operating strategy | Owner requirements and lifecycle cost review |
Use this table as an enquiry and review checklist. Project design, acceptance criteria and released records remain project-specific.
References, disclosure and change record
References and further verification
Disclosure: East Baoyu manufactures and supplies products discussed on this website. Structured drafting tools may assist research and editing, but technical claims, project inputs and release decisions require human review.
Version 2.0: Rebuilt with common-model and constructability tables, resource and geometry controls, loss waterfall, clipping/grid value, lifecycle economics, sensitivity, handover requirements, FAQs and imagery.
View the public Content Change Log · Corrections: info@baolaipipes.com